
HOW TO MEASURE ANYTHING IN
PROJECT MANAGEMENT
Welcome to the website for How to Measure Anything in Project Management. This is where readers can come to download resources mentioned in the book. These downloads include spreadsheet templates, sample models, and companion tools to help you apply the methods from the book directly to your own projects. Use the HTMA-PM Chatbot to answer your questions about the book and resources!
")
Ask the HTMA-PM Chat Bot!
Looking to apply How to Measure Anything in Project Management to your project? Want guidance on what tools to use? Ready to reduce uncertainty and make better decisions?
Disclaimer: This AI-powered assistant provides general guidance and illustrative estimates. Responses are automatically generated and are intended for educational and informational purposes only. They should not be regarded as precise forecasts or a substitute for professional training, expert analysis, or formal consulting. For tailored project support, please contact Hubbard Decision Research directly at info@hubbardresearch.com.

INTERESTED IN HDR’S TRAINING?
Hubbard Decision Research offers comprehensive training in quantitative methods that decision-makers and analysts alike can apply across industries. Whether you’re looking to improve your risk analysis, forecasting, or decision-making skills, our courses provide the hands-on learning and real-world application you need to make confident, data-driven decisions.
If you are interested in learning more about Project Management, check out the 2-Hour, “How to Measure Anything in Project Management” webinar delivered by Doug Hubbard. This webinar will change how you view and measure project management risk and provide you with the tools to better protect your organization.


EXPLORE MORE RECOMMENDED TRAINING COURSES HERE

Meet the Authors
Douglas W. Hubbard
Douglas Hubbard is the inventor of the Applied Information Economics (AIE) method and founder of Hubbard Decision Research (HDR). He is the author of How to Measure Anything: Finding the Value of Intangibles in Business, The Failure of Risk Management: Why It’s Broken and How to Fix It, Pulse: The New Science of Harnessing Internet Buzz to Track Threats and Opportunities and his latest book, How to Measure Anything in Cybersecurity Risk, 2e. He has sold over 200,000 copies of his books in eight different languages. Three of his books have been required reading for the Society of Actuaries exam prep. In addition to his books, Mr. Hubbard has been published in several periodicals including Nature, The IBM Journal of Research and Development, OR/MS Today, Analytics, CIO, Information Week, and Architecture Boston.
Mr. Hubbard’s career has focused on the application of AIE to solve current business issues facing today’s corporations. Mr. Hubbard has completed over 200 risk/return analyses of large, critical projects, investments and other management decisions in the last 25 years. AIE is the practical application of several fields of quantitative analysis including Bayesian analysis, Monte Carlo simulations, and many others. Mr. Hubbard’s consulting experience totals over 36 years and spans many industries including insurance, financial services, pharmaceutical, healthcare, utilities, energy, federal and state government, entertainment media, military logistics, and manufacturing. His AIE methodology, has received critical praise from The Gartner Group, The Giga Information Group, and Forrester Research. He is a popular speaker at valuation, risk, metrics and decision analysis conferences all over the world.
Dr. Alexander Budzier
Dr. Alexander Budzier is an internationally recognized authority on project management, risk, and strategic decision-making. A fellow at the Saïd Business School, University of Oxford, he has spent more than a decade at the forefront of research into why projects fail and what it takes to make them succeed.
Alexander’s work spans disciplines and industries. He has advised governments, global corporations, and multilateral organizations on improving the performance of complex projects from digital transformations to megainfrastructure. As a co-founder of Oxford Global Projects, he combines academic rigor with deep practical insight, helping organizations design and deliver projects that achieve real-world impact.
He is best known for his pioneering research on cost overruns and forecasting error, particularly in IT and infrastructure. His work with Bent Flyvbjerg and colleagues has helped uncover the statistical realities of project failure, often buried under decades of professional lore, and has reshaped the way leaders think about uncertainty and risk.
Alexander’s writing is marked by clarity, accessibility, and intellectual honesty. He is co-author of Intelligent Change – The Science Behind Digital Transformations (with Thomas Gottschalck, Kim Bjørn Thuesen, and Astrid Lanng), and his articles have appeared in leading journals and media outlets.
He believes in combining analytical thinking with thoughtful execution. His teaching at Oxford reflects this ethos, as does his work with leaders across sectors who are serious about building what matters: on time, on budget, and on purpose.
When he’s not teaching, writing, or working on a project site somewhere in the world, you might find him knitting together ideas for the next big question in project management: one rooted not just in solid theory, but in sound practice.
Andreas Bang Leed
Andreas Leed is Head of Data Science at Oxford Global Projects and a PhD researcher in economics at Aarhus University. He specializes in applying data science to improve planning and risk management for large-scale capital projects and has advised public and private sector clients across six continents. He manages the world’s largest database of project performance data and has led independent risk assessments for megaprojects in all sectors, including high-speed rail, nuclear energy, and long-horizon infrastructure such as nuclear waste storage and national healthcare systems.
Andreas has authored official guidance on project estimating and appraisal for multiple governments. He also led the development of a machine learning–based early warning system for the Hong Kong Development Bureau, now in use across hundreds of active projects and credited with portfolio savings in the billions.
At Aarhus University, his PhD research focuses on integrating biodiversity valuation into cost-benefit analysis frameworks for major infrastructure projects. Andreas also holds an MSc in Political Science and serves as an external examiner for advanced quantitative methods and data science at Danish universities.
Andreas is a strong advocate for measurable thinking in public decision-making—championing the use of empirical evidence, probabilistic forecasting, and data-driven insight to improve the outcomes of complex projects. He is a frequent speaker at international conferences and has been featured on national television and in print media, contributing to the public debate on infrastructure prioritization, planning, and risk.
Download Book Resources
Here is where readers can download resources mentioned in the book. These downloads include spreadsheet templates, sample models, and companion tools to help you apply the methods directly to your own projects.
Information Value | One-for-One Substitution | Calibration Test Distributions | Calibration Questions | AI Estimation | Gantt Chart | Bayesian Probability
t-Distribution | Beta Distribution | Catch-Recatch | Regression | Distribution Probabilities | Keelin & Kernel Distribution | Experiments | Lens Method
Machine Learning | Technology Regret | AI Risk Register | Probability Distributions | PRNG Conference Paper | AIE White Paper
Not sure where to start? Check out these resources from HDR:
Chapter 4: Calculating Information Value
This workbook demonstrates how to calculate the value of reducing uncertainty for two types of distributions. The first tab models a normal distribution by slicing outcomes into thousands of pieces, while the second tab shows a uniform distribution where all outcomes are equally likely. Enter your own values to see how the expected value of perfect information (EVPI) changes under each approach.
Chapter 5: One-for-One Substitution Model Example
This workbook contains examples for the “one-for-one substitution” model described in Chapter 5. There are three tabs. The first tab provides a risk register that demonstrates how subjective expert input can be translated into fully quantitative risk analysis, replacing traditional heat maps with probabilistic modeling. The second tab shows the Monte Carlo Simulation and how to plot the “loss exceedance curve” (LEC) as shown in figure 5.6. Finally, there is a tab showing how multiple portfolios can be combined to make an aggregate LEC.
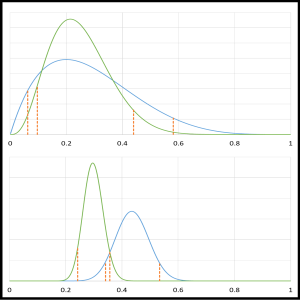
Chapter 6: Expected Distributions of Calibration Test Results
This workbook presents the calculated probabilities of various outcomes on calibration tests. Although these charts are not included in the published version of the book, they illustrate concepts discussed in Chapter 6. Specifically, they model how calibration responses would be distributed under the assumption that all test-takers are perfectly calibrated. These results provide a theoretical benchmark against which actual calibration test data can be compared.
Chapter 6: Additional Calibration Questions
This resource provides additional calibration questions and answers not found in the book to help build your intuitions.
Get the REAL calibration training here! HDR provides asynchronous training with self-paced videos so you can practice with proven methods, all while seeing your real-time calibration results on the calibrator dashboard. The data can even be used to optimize estimates for real-life problems with Team Calibrator!
Chapter 6: AI Estimation Instructions
This resource provides a practical introduction to using AI for estimation, with examples of generating confidence intervals through chatbots and integrating prompts directly into Excel.
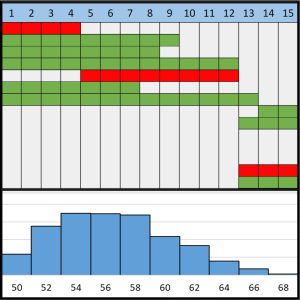
Chapter 7: Gantt Chart
This workbook uses a Monte Carlo Gantt chart to show how uncertainties in project schedules add up. It visually displays the start and end times of tasks, then simulates how delays and dependencies between tasks affect overall project duration. The tool also calculates the criticality of each task and its expected contribution to total duration. A built-in risk register feeds into the simulation, allowing you to see how potential risk events impact project timelines.
Chapter 10: Bayesian Probability
This spreadsheet introduces Bayesian probability through simple, interactive examples. Using the analogy of drawing marbles from two urns, it shows how new evidence updates prior beliefs to form more accurate predictions. One example applies this logic to testing whether AI performs better than humans, while another estimates the chance a project will be canceled if it is over budget.
Chapter 10: Random Sampling and the t-Distribution
This workbook provides interactive tools for working with the t-distribution and confidence intervals based on random samples. The first tab shows how to use the t-statistic to estimate the confidence interval of a population mean from sample data. The second tab demonstrates how confidence intervals change across different populations and sample sizes, with dynamic graphs that illustrate how the interval narrows as more data are included. Users can adjust inputs and select among populations to explore the behavior of sample means under uncertainty.
Chapter 10: Beta Distribution
This workbook helps you estimate uncertainty about a proportion (for example, what percentage of customers prefer a product, or how often projects get canceled). It uses a beta distribution, which lets you start with a prior belief and then update it as new data come in. Simply enter your prior estimates and new observations, and the charts and calculations will show how your confidence changes.
Chapter 10: Catch-Recatch Population Estimation
This spreadsheet demonstrates how to estimate the size of a population when you can’t count or observe all of it directly. By entering two sample sizes and the overlap between them (for example, the number of tagged fish recaptured), you can see how the 90% confidence interval for the population size is calculated using the beta distribution.
Chapter 10: Regression
This workbook introduces different types of regression models in Excel using project management examples. One sheet demonstrates simple linear regression, using the number of tasks in a project phase to predict completion time. Another shows how to build dynamic multiple regression models with the LINEST() function, letting you include or exclude variables on the fly. A third sheet illustrates logistic regression, estimating how budget relates to the probability of project cancellation using Solver. The final sheet explores nonlinear and interaction effects, using LOGEST() for log-scale fits and LINEST() to test how combinations of variables can strongly predict outcomes.
Chapter 10: Distribution Probabilities (Bayesian Sampling Example)
This workbook lets you test which distribution best fits your data when the true shape is unknown. Enter candidate distributions and sample observations, and the spreadsheet automatically updates probabilities and displays dynamic graphs of the candidate distributions, probability-weighted averages, observed outcomes, and how probabilities update as more data are added.
Chapter 10: Keelin and Kernel Distribution Estimation
This workbook introduces two methods for modeling probability distributions when data is limited or irregular. One sheet demonstrates the Keelin MetaLog distribution, which can be fitted to percentiles or expert judgments, and the other shows how to build a kernel density estimate (KDE) that uses data directly without assuming a fixed shape. Both tools let you explore uncertainty and create flexible probability models for project and risk analysis.
Chapter 10: Controlled Experiments
This sheet outlines an example method for analyzing controlled experiments. It demonstrates a z-test for comparing test and control groups and requires sample sizes larger than 30. Enter your own values or try the provided examples to see how results change.
Chapter 10: Lens Method
This workbook demonstrates the Lens Method, a model for comparing expert judgment to actual outcomes in order to improve forecasting. By entering likelihood estimates alongside observed results, the tool evaluates calibration, consistency, and accuracy of predictions. Users can explore how well different experts or models align with real data and identify ways to adjust future estimates for better decision-making.
Chapter 10: Machine Learning
This workbook shows how to build and use the machine learning method, Classification and Regression Trees (CART), entirely in Excel. Instead of relying on an automated algorithm, you step through the process manually—testing candidate splits, recording choices, and seeing how each decision affects predictions. It provides a simplified, transparent way to understand how CART works and how decision trees can be applied to project data.
Chapter 11: Technology Regret Analysis
This workbook models a technology regret analysis to help you evaluate the costs and benefits of adopting or delaying a new technology. It uses Monte Carlo simulation and scenario inputs to estimate when adoption is optimal, measure potential regret from acting too early or too late, and explore how uncertainty in costs and benefits affects the decision.
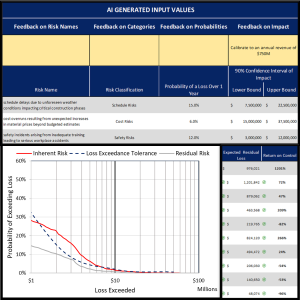
Chapter 11: AI-Enabled Risk Register
This resource demonstrates how Artificial Intelligence can be combined with expert judgment to produce a fully quantitative risk analysis. The workbook translates likelihood and impact estimates into probabilistic models suitable for simulation. Users can generate AI-based starting points, adjust them with their own expertise, and produce outputs such as expected and simulated losses, risk reduction from controls, and loss exceedance curves.
Appendix 3: Selected Probability Distributions in Excel
This workbook includes the calculations for Appendix 3: Selected Distributions. It includes several useful random distributions that apply to a variety of estimations that may be included in a model for project management. For instance, the Binary distribution produces a simulated value of “1” or “0”, which can be used as “event occurred” or “event didn’t occur” in simulating risk. Other distributions are more appropriate for impacts of a risk event. These distributions can also be used to simulate costs and benefits.
Conference Paper for PRNG
This paper, authored by Doug Hubbard, explains the pseudorandom number generator developed and applied at Hubbard Decision Research. It describes both the underlying algorithm and its implementation, emphasizing how the generator ensures statistical validity and practical reliability in simulation modeling.
AIE White Paper
This white paper introduces the principles and applications of Applied Information Economics (AIE), a decision analysis framework that combines quantitative modeling with practical business insights. While it is written with IT managers in mind, the methods address broader organizational challenges involving risk, uncertainty, and resource allocation.